


- Joined
- Jun 13, 2020
- Messages
- 7,957
- Reaction score
- 954
- Points
- 212
- Awards
- 2
With more and more exploits being written in JavaScript, even some 0-day, there is a need to be able to reverse exploits written in JavaScript beyond de-obfuscation. I spent some time this weekend searching Google for a simple way to reverse JavaScript shellcode to assembly. I know people do it all the time. It’s hardly rocket science. Yet, I didn’t find any good walk-throughs on how to do this. So I thought I’d write one.
For this walk-through, I’ll start with JavaScript that has already been extracted from a PDF file and de-obfuscated. So this isn’t step 1 of fully reversing a PDF exploit, but for the first several steps, check out Part 2 of this slide deck.
What you’ll need:
Step 1 – Converting from UTF-encoded characters to ASCII
Most JavaScript shellcode is encoded as either UTF-8 or UTF-16 characters. It would be easy enough to write a tool to convert from any one of these formats to the typical x-ed UTF-8 format that we’re used to seeing shellcode in. But because of the diversity of encoding and obfuscation showing up in JavaScript exploits today, it’s more reliable to use JavaScript to decode the shellcode.
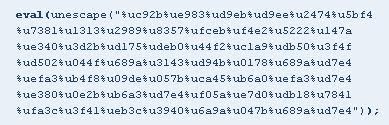
For this task, you need a JavaScript debugger. Didier Stevens’ SpiderMonkey mod is a great choice. Start by preparing the shellcode text for passing to the debugger. In this case, drop the rest of the exploit, and then wrap the unescape function in an eval function:

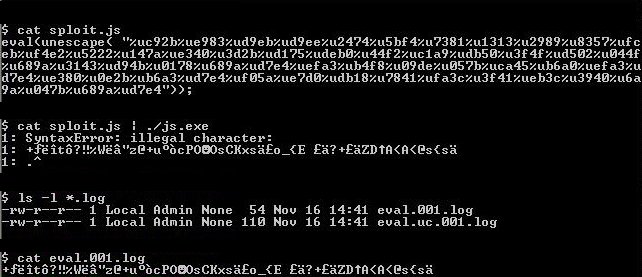
Now run this code through SpiderMonkey. SpiderMonkey will create two log files for the eval command, the one with our ASCII shellcode is eval.001.log.

Step 2 – crap2shellcode.pl
This is why I wrote this script, to take an ASCII dump of some shellcode and automate making it debugger-friendly.
—cut—
#!/bin/perl
#
# crap2shellcode - 11/9/2009 Paul Melson
#
# This script takes stdin from some ascii dump of shellcode
# (i.e. unescape-ed JavaScript sploit) and converts it to
# hex and outputs it in a simple C source file for debugging.
#
# gcc -g3 -o dummy dummy.c
# gdb ./dummy
# (gdb) display /50i shellcode
# (gdb) break main
# (gdb) run
#
use strict;
use warnings;
my $crap;
while($crap=<stdin>) {
my $hex = unpack('H*', "$crap");
my $len = length($hex);
my $start = 0;
print "#include <stdio.h>nn";
print "static char shellcode[] = "";
for (my $i = 0; $i < length $hex; $i+=4) {
my $a = substr $hex, $i, 2;
my $b = substr $hex, $i+2, 2;
print "\x$b\x$a";
}
print "";nn";
}
print "int main(int argc, char *argv[])n";
print "{n";
print " void (*code)() = (void *)shellcode;n";
print " code();n";
print " exit(0);n";
print "}n";
print "n";
–paste–
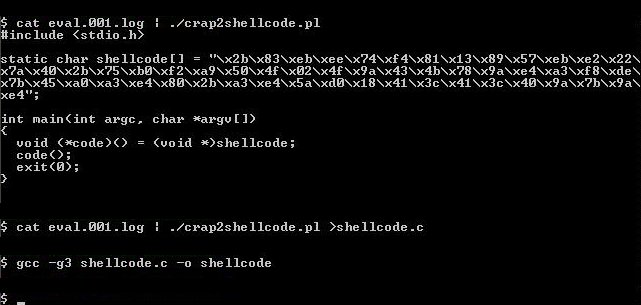
The output of passing eval.001.log through crap2shellcode.pl is a C program that makes debugging the shellcode easy.

Step 3 – View the shellcode/assembly in a debugger
First we have to build it. Since we know that this shellcode is a Linux bindshell the logical choice for where and how to build is Linux with gcc. Similarly, we can use gdb to dump the shellcode. For Win32 shellcode, we would probably pick Visual Studio Express and OllyDbg. Just about any Windows C compiler and debugger will work fine, though.
To build the C code we generated in step 2 with gcc, use the following:
gcc -g3 shellcode.c -o shellcode
The ‘-g3’ flag builds the binary with labels for function stack tracing. This is necessary for debugging the binary. Or at least it makes it a whole lot easier.
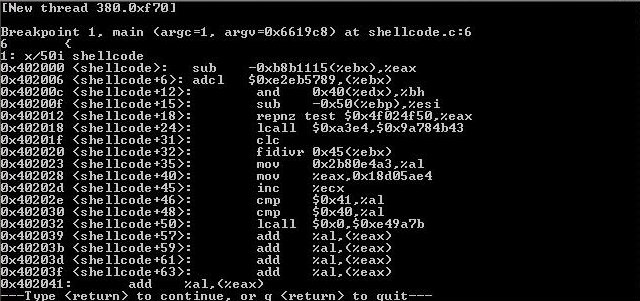
Now open the binary in gdb, print *shellcode in x/50i format, set a breakpoint at main(), and run it.
$ gdb ./shellcode
(gdb) display /50i shellcode
(gdb) break main
(gdb) run

For this walk-through, I’ll start with JavaScript that has already been extracted from a PDF file and de-obfuscated. So this isn’t step 1 of fully reversing a PDF exploit, but for the first several steps, check out Part 2 of this slide deck.
What you’ll need:
- A safe place to play with exploits (I’ll be using an image in VMWare Workstation.)
- JavaScript debugger (I highly recommend and will be using Didier Stevens’ modified SpiderMonkey.)
- Perl
- The crap2shellcode.pl script, which you’ll find further down in this post
- A C compiler and your favorite binary debugger
Step 1 – Converting from UTF-encoded characters to ASCII
Most JavaScript shellcode is encoded as either UTF-8 or UTF-16 characters. It would be easy enough to write a tool to convert from any one of these formats to the typical x-ed UTF-8 format that we’re used to seeing shellcode in. But because of the diversity of encoding and obfuscation showing up in JavaScript exploits today, it’s more reliable to use JavaScript to decode the shellcode.
For this task, you need a JavaScript debugger. Didier Stevens’ SpiderMonkey mod is a great choice. Start by preparing the shellcode text for passing to the debugger. In this case, drop the rest of the exploit, and then wrap the unescape function in an eval function:
Now run this code through SpiderMonkey. SpiderMonkey will create two log files for the eval command, the one with our ASCII shellcode is eval.001.log.
Step 2 – crap2shellcode.pl
This is why I wrote this script, to take an ASCII dump of some shellcode and automate making it debugger-friendly.
—cut—
#!/bin/perl
#
# crap2shellcode - 11/9/2009 Paul Melson
#
# This script takes stdin from some ascii dump of shellcode
# (i.e. unescape-ed JavaScript sploit) and converts it to
# hex and outputs it in a simple C source file for debugging.
#
# gcc -g3 -o dummy dummy.c
# gdb ./dummy
# (gdb) display /50i shellcode
# (gdb) break main
# (gdb) run
#
use strict;
use warnings;
my $crap;
while($crap=<stdin>) {
my $hex = unpack('H*', "$crap");
my $len = length($hex);
my $start = 0;
print "#include <stdio.h>nn";
print "static char shellcode[] = "";
for (my $i = 0; $i < length $hex; $i+=4) {
my $a = substr $hex, $i, 2;
my $b = substr $hex, $i+2, 2;
print "\x$b\x$a";
}
print "";nn";
}
print "int main(int argc, char *argv[])n";
print "{n";
print " void (*code)() = (void *)shellcode;n";
print " code();n";
print " exit(0);n";
print "}n";
print "n";
–paste–
The output of passing eval.001.log through crap2shellcode.pl is a C program that makes debugging the shellcode easy.
Step 3 – View the shellcode/assembly in a debugger
First we have to build it. Since we know that this shellcode is a Linux bindshell the logical choice for where and how to build is Linux with gcc. Similarly, we can use gdb to dump the shellcode. For Win32 shellcode, we would probably pick Visual Studio Express and OllyDbg. Just about any Windows C compiler and debugger will work fine, though.
To build the C code we generated in step 2 with gcc, use the following:
gcc -g3 shellcode.c -o shellcode
The ‘-g3’ flag builds the binary with labels for function stack tracing. This is necessary for debugging the binary. Or at least it makes it a whole lot easier.
Now open the binary in gdb, print *shellcode in x/50i format, set a breakpoint at main(), and run it.
$ gdb ./shellcode
(gdb) display /50i shellcode
(gdb) break main
(gdb) run